Data-driven decision-making is the basic requirement of the current environment for any organization. EDA is an extremely successful method in business applications that helps businesses discover unexplored business opportunities, divulge patterns, and realize hidden insights. The power of data, through EDA, drives innovation and is of utmost importance in terms of competitive advantage.
Exploratory Data Analysis
EDA is the process of looking at data sets to summarize their main characteristics, often through visual means. Unlike traditional methods of data analysis, which depend on preconceived hypotheses, EDA promotes a more open-ended investigation.
By letting data speak for itself, EDA helps in pointing out anomalies, patterns, and relationships that would otherwise be left unnoticed. It is not merely about cleaning or processing data but rather about curiously and creatively exploring it.
The Business Value of EDA
Businesses collect masses of data every day, but the true value lies in those unseen insights. Here’s how EDA can unlock business potential:
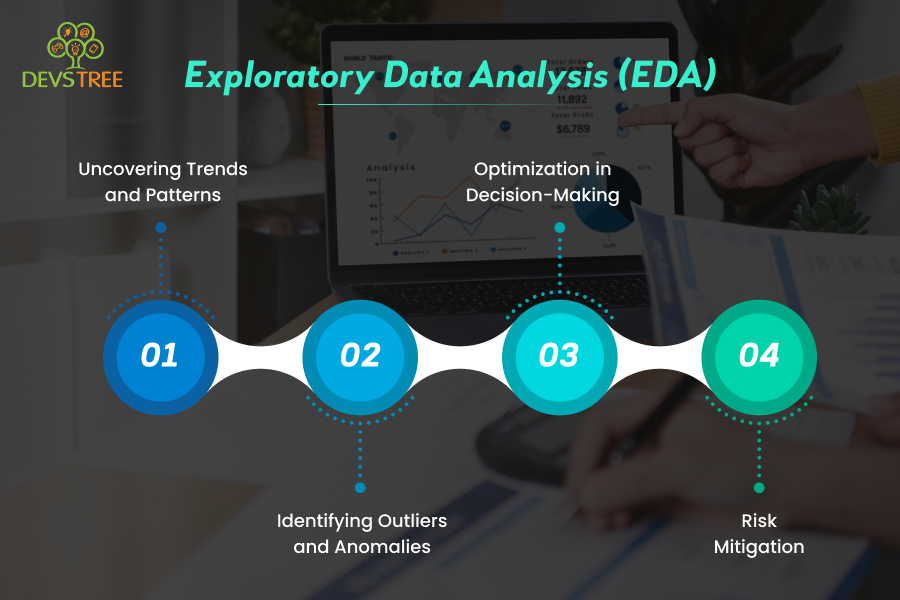
- Uncovering Trends and Patterns: EDA can spot recurring trends in sales, customer behavior, or operational inefficiencies. These patterns recognized early can give businesses a competitive advantage to change their strategy in those areas as well.
- Identifying Outliers and Anomalies: Outliers can signal problems and opportunities. For example, an anomalous increase in sales for a certain product may highlight a previously unidentified market or customer need.
- Optimization in Decision-Making: Charts, graphs, and interactive dashboards make complex datasets easily understandable by decision-makers. Such clarity in the data is a good guide to strategic planning and resource utilization so that the business moves at the right time and with informed action.
- Risk Mitigation: EDA helps highlight irregular patterns that indicate potential risk areas for operational issues or fraudulent activities. Identification at an early stage helps businesses take corrective measures before small issues become major issues.
Case Studies and Success Stories
A retail company is experiencing significant variation in the sales figures. After implementing EDA, this particular company found that an age group, in particular, was shopping online rather than going to stores. Based on this result, the company focused on a specific digital marketing plan, leading to an increase of 20% in online sales and subsequently improvement in the overall revenue.
Another example is that of a manufacturing company using EDA to analyze production line data. The analysis showed that output was spotty and correlated with equipment maintenance schedules. The company adjusted its maintenance routines and optimized the use of equipment, which reduced downtime by 15% and increased overall productivity.
These examples show how EDA is not just about data but about transforming raw information into actionable business strategies.
Key Tools and Techniques
Several tools and techniques have been known to work best for EDA. Popular programming languages such as Python and R offer vast libraries like Pandas, matplotlib, and ggplot2 to simplify data manipulation and visualization. Modern BI platforms that include Tableau and Power BI make interactive data exploration with an intuitive interface possible. The point is to choose the right tool for your business needs and data complexity.
Techniques Commonly Applied in EDA Are:
- Descriptive Statistics: Computation of mean, median, standard deviation, and other statistics to summarize data.
- Data Visualization: Graphs, histograms, and scatter plots are used for visual inspection of the distribution and relationship of the data.
- Correlation Analysis: How variables interrelate, can be of paramount importance for forecasting and strategic planning.
- Hypothesis Testing: Although EDA is an exploratory exercise, forming hypotheses and testing based on preliminary observations may validate observed patterns.
Application of EDA in Your Business Strategy
Integrating EDA into business processes does not necessarily mean all existing systems should be overhauled. Rather, start by identifying the key performance indicators of utmost importance to your business, then use the techniques of EDA to examine these KPIs and spot emerging trends or anomalies. Progressively, it is possible to include more sophisticated data analytics and visualization tools that can expand these insights.
Conclusion:
Beyond just a technical process, exploratory data analysis is a strategic tool that will enable companies to discover untapped potential and make the right decisions. Organizations can gain a competitive edge in the fast-paced market of today, enhance processes, and uncover insightful information by utilizing EDA.
Our goal at Devstree IT is to assist you in realizing the full potential of your data. Leverage EDA to transform raw data into strategic opportunities that fuel growth and innovation.